 in the tool menu.
In the tool menu there is also a quick selection of themes.
in the tool menu.
In the tool menu there is also a quick selection of themes.Here, you change settings for how your pie chart will look. The changes are displayed directly in the preview and are valid only for the current print.
You can find the settings in the preview below the button
in the tool menu.
In the tool menu there is also a quick selection of themes.
You can choose to save the current settings either as:
 Save theme as default
which saves the current settings as default for the chart type or
Save theme as default
which saves the current settings as default for the chart type or
 Save settings as theme
which saves the current settings as a new theme or overwrites the existing one.
Save settings as theme
which saves the current settings as a new theme or overwrites the existing one.
Here you choose Background color, Text color and Frame color.
For all of these, you can choose to follow a particular pattern and be based on the choices you make
in the table below.
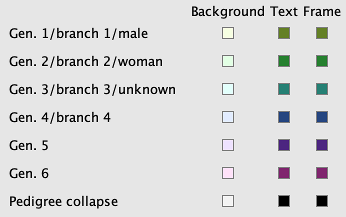
You have five options:
There is also a choice for how the main persons pedigree collapse will look and it applies to everyone regardless of the choices above.
 By pressing when you change a value
will cause all the values for the same category to get that value.
By pressing when you change a value
will cause all the values for the same category to get that value.
The pie chart form is set in degrees between 180 and 360.
Where you enter:
Where you enter what should be displayed in person boxes.
Where you specify how you want the frame around the tree to look like.
Where you change the background. In File, you can specify an image to cover the background or an empty box if you do not want an image. If you have selected an image, you can specify how the image is displayed in the list Display where the Size fills both the height and width, Width fills the width, Height fills the height and Repeat fills the background with so many images that fit in its original size.
© Genney